One platform to monitor, understand, and act
Eclarix brings together infrastructure monitoring, network visibility, service performance tracking, AIOps analytics, and SLA intelligence in a single platform.
-
Unified Control Plane
Leverage Eclarix tools to track data across diverse configuration items from multiple data sources. Pre-built template libraries streamline management of standard configurations.
-
AIOps Intelligence
Embed machine learning for automated event correlation, anomaly detection, predictive analytics, and AI-assisted root cause analysis directly into your monitoring workflow.
-
SLA Compliance
Ensure continuous 24/7/365 monitoring of IT service quality metrics against SLA targets. Define clear ownership boundaries for each department and optimize operational efficiency.
-
Scalability
Our company works according to the principle of individual approach to every client. This method allows us to achieve success in problems of all levels.
-
Data Visualization
Gain clear, at-a-glance visibility into your distributed infrastructure through a unified interface with intuitive dashboards, charts, and reports.
-
Support
Backed by a dedicated expert team, Eclarix provides comprehensive support throughout the entire solution lifecycle — from design and deployment to ongoing operations and continuous user training.
An universal platform engineered for immediate adoption in production-grade enterprise infrastructures
Infrastructure Monitoring
Monitoring of physical and virtual servers, workstations, database management systems (DBMS), virtualization and containerization platforms, data storage systems, and backup infrastructure.
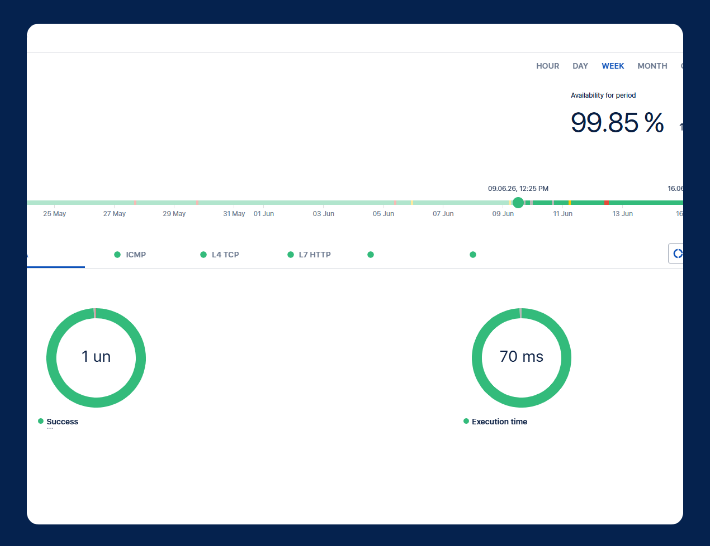
Network Equipment and Communication Channel Monitoring
Availability monitoring and performance metrics tracking for network devices, L2/L3 VPN tunnel monitoring with load testing capabilities, supervision of network services and protocols, plus user traffic collection and analysis.
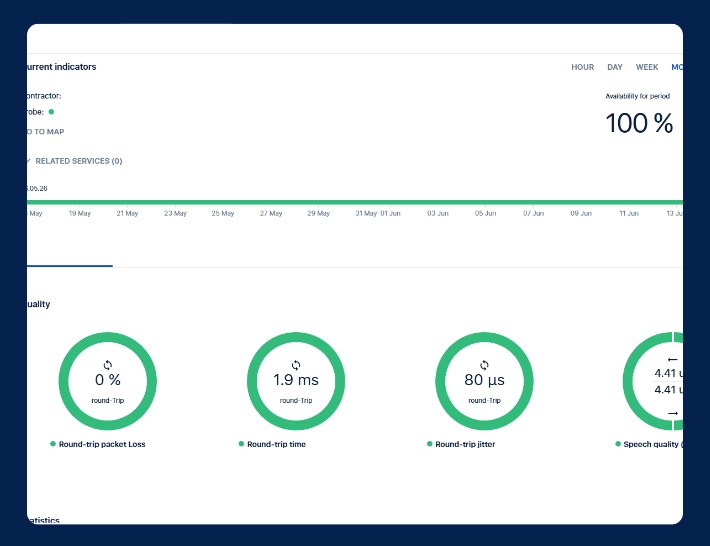
Information Systems and Cloud Application Monitoring
Monitoring of corporate systems and cloud services, web applications and portals, document management and accounting systems, CRM, ERP, and 1C platforms, plus video conferencing availability checks.
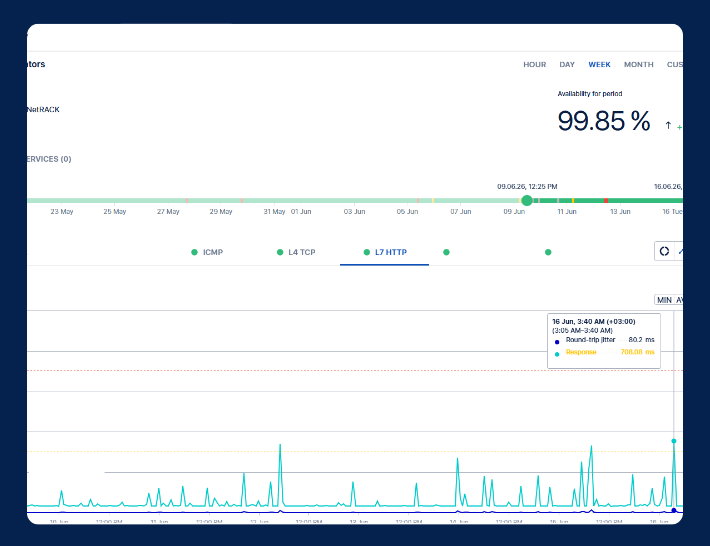
SLA Service Level Monitoring
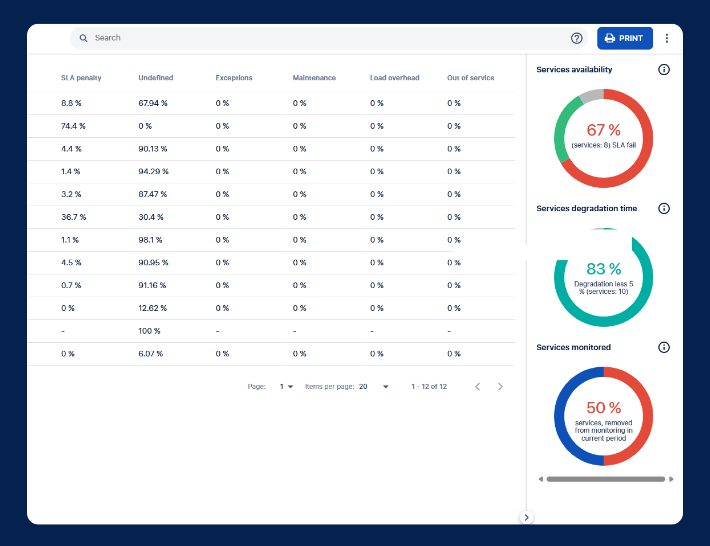
Track SLA compliance by analyzing IT service quality against defined criteria. Clearly define responsibilities across teams and departments. Gain transparent visibility into departmental performance through automated, insight-driven reporting.
AIOps Engine
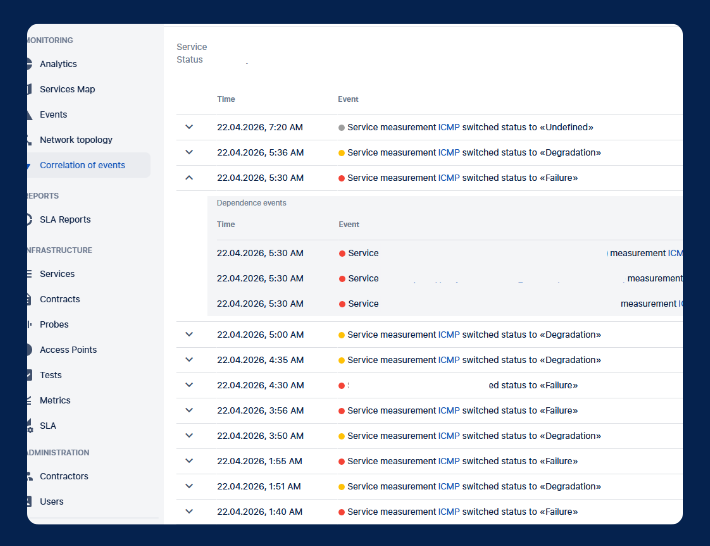
Machine learning and AIOps-capabilities on top of its core monitoring architecture. These functions are designed to help teams process large volumes of operational events more effectively, correlate service failures, identify likely causes of disruption, and reduce the amount of manual investigation required during incident response.
AI Observability Platform Eclarix
It collects signals from across your IT landscape, correlates events, highlights anomalies, identifies likely root causes, and helps teams respond faster with the right operational context.
Write to us
Tell us about your monitoring challenges — we’ll show how Eclarix turns noise into clear, actionable signal for your team.