End-to-end IT monitoring with AIOps and SLA intelligence
A unified monitoring platform for IT infrastructure, systems, and applications — with built-in ML for anomaly detection, event correlation, and root cause analysis.
- See the full IT environment in one operational view.
- Detect service risks before they turn into outages.
- Cut investigation time and reduce alert noise.
- Protect SLA performance with clearer operational context.
See clearly. Act before it fails.
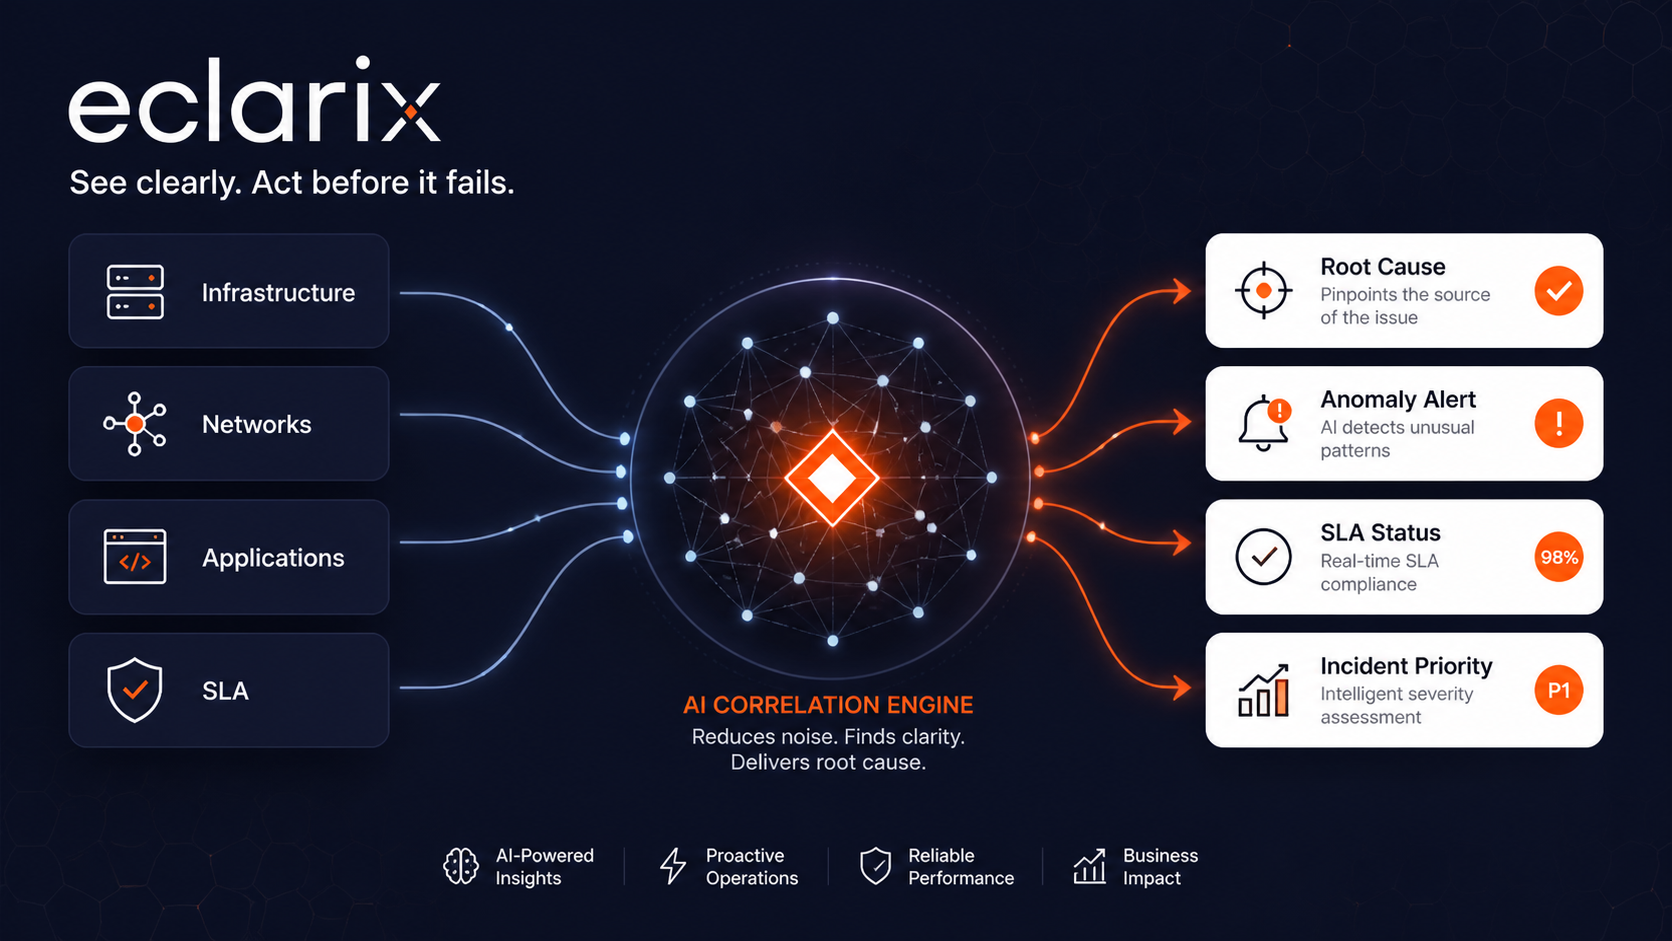
One platform. Complete operational clarity.
Stop switching between disconnected monitoring tools. Bring infrastructure, networks, systems, applications, and SLA performance into a single platform so every team works from the same operational view.
One operational picture across the entire IT environment
Stop switching between disconnected monitoring tools. Bring infrastructure, networks, systems, applications, and SLA performance into a single platform so every team works from the same operational view.
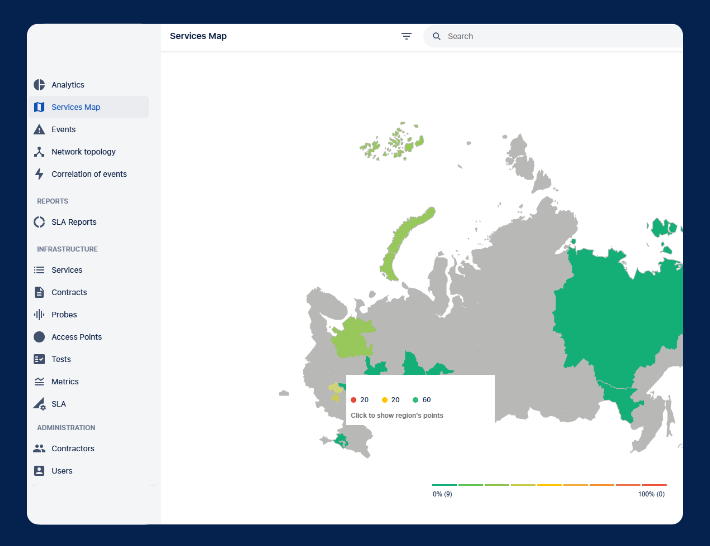
Find the real cause faster, not just the symptoms
ML-powered event correlation and root cause analysis connect related signals across the IT environment automatically. What used to take hours of manual investigation takes minutes — with clearer context, likely causes, and service impact already surfaced.
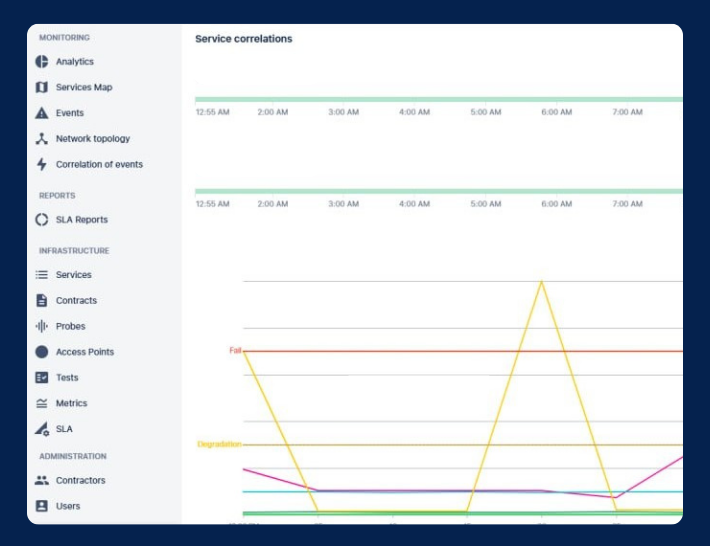
Catch service risks before users notice
ML-powered anomaly detection identifies degradation patterns and SLA risks early, so teams can respond before performance issues escalate into outages. Move from reactive firefighting to proactive service control.
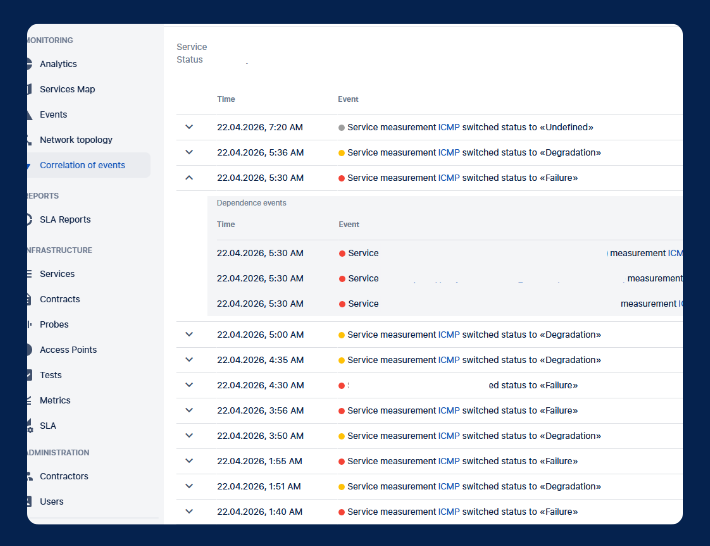
Less noise. More signal. Faster decisions
Automated event correlation filters out redundant alerts and groups related incidents, so NOC, SRE, and support teams focus only on what requires action — and coordinate faster with shared visibility into service status and accountability.
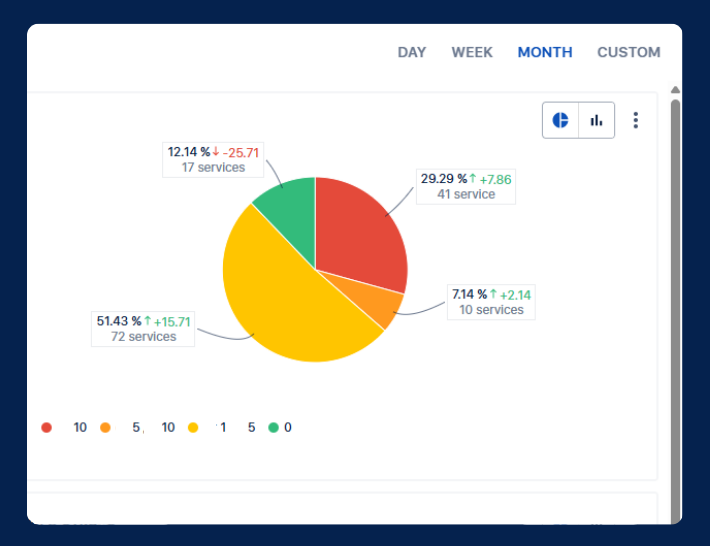
How It Works
-
Collect
Continuously gather metrics, events, and service indicators from infrastructure, communication channels, information systems, and applications across the entire IT environment.
-
Correlate
Connect related signals from different IT layers automatically. Instead of hundreds of isolated alerts, teams get a structured picture of what is happening and where.
-
Detect
ML-powered anomaly detection identifies unusual behavior, performance degradation, and SLA risks early — before they escalate into service-impacting incidents.
-
Explain
Root cause analysis surfaces the most likely cause with service topology and event context. Teams spend less time investigating and more time resolving.
-
Act
Respond faster with clear incident context, integrated workflows, and automated notifications — restore service quality with less manual coordination.
Modules
Complete visibility across the entire IT landscape with ML-powered functions that make monitoring smarter.
-
IT Infrastructure Monitoring
Track physical and virtual servers, databases, and storage so infrastructure health stays visible before capacity or performance issues spread.
-
Network Equipment and Communication Channel Monitoring
Monitor device availability, VPN channels, and network services to keep connectivity and communication paths under control.
-
Information Systems and Cloud Application Monitoring
Observe web applications, portals, CRM, ERP, and collaboration tools with shared context across on-prem and cloud workloads.
-
SLA Service Level Monitoring
Measure service-level compliance continuously and generate clear reports that show risk trends before commitments are breached.
-
AIOps Engine
Correlate incidents, detect anomalies with ML, and surface likely root causes so teams can act with less noise and faster resolution.
Business outcomes that matter to operations teams
Stop switching between disconnected monitoring tools. Bring infrastructure, networks, systems, applications, and SLA performance into a single platform so every team works from the same operational view.
- Better visibility across complex distributed environments.
- Lower manual effort in day-to-day incident operations.
- Faster incident diagnosis and service recovery.
- Earlier detection of SLA risks and service degradation.
- Less alert fatigue and fewer wasted investigations.
- Clearer service accountability across teams and support zones.
Built for the industries where downtime has a price tag
From a telecoms NOC flooded with alerts to a bank’s payment system under regulatory scrutiny — Eclarix gives IT teams the unified visibility and ML-powered intelligence to act before incidents happen.
-
Telecom
When your network is the product, every outage is a contract violation
Learn more -
Financial Services
Every second of downtime is a direct loss — and a regulatory risk
Learn more -
Retail & E-Commerce
A crashed checkout at peak hour doesn’t cost a sale — it costs a customer
Learn more -
Manufacturing
A network blind spot on the factory floor doesn’t slow things down — it stops the line
Learn more -
Technology & SaaS
Every second of downtime is a broken promise to your customer
Learn more -
Logistics & Transportation
When real-time tracking systems go dark, the entire supply chain goes blind
Learn more
Write to us
Tell us about your monitoring challenges — we’ll show how Eclarix turns noise into clear, actionable signal for your team.